44 Years at a Glance
Campbell River – Zone 1 – Single Family, 1982 to 2026
34 of 44 years prices went up | 10× growth in the average price | 35 of 35 ten-year stretches ended higher | 5.4% average yearly price growth
Red Happens. Green Wins.
We recently rebuilt our Campbell River market history charts, going back to 1982 for single family homes and 2000 for condos. Every year gets a colour: green when the average sale price went up, and red when it went down. Step back and look at the whole picture and one thing jumps out. There is some red, but the green wins, by a wide margin.
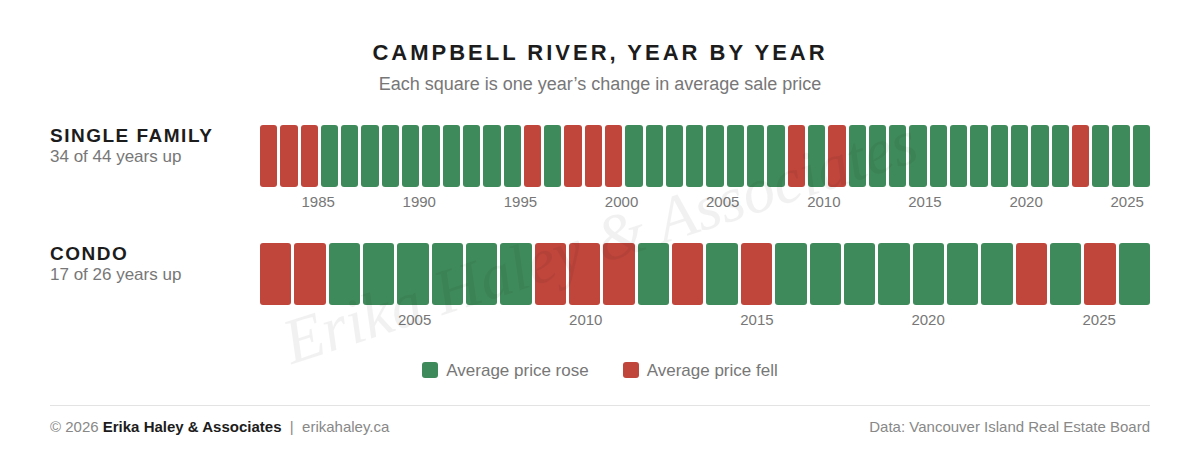
Single family homes rose in 34 of the last 44 years; condos rose in 17 of 26. Source: VIREB Graphstats.
What the Colours Tell Us
The average single family home in Campbell River sold for $75,087 in 1982. Over the last 12 months it was $764,814, roughly ten times as much. The red years were real, but they came in short clusters: the early 1980s, the late 1990s, 2009 and 2011, and 2023. The biggest single-year drop was 11% in 2009, and every dip was followed by a return to green.
Condos tell a similar story with bigger swings. The average condo went from $104,652 in 2000 to $431,488 over the last 12 months, about four times as much.
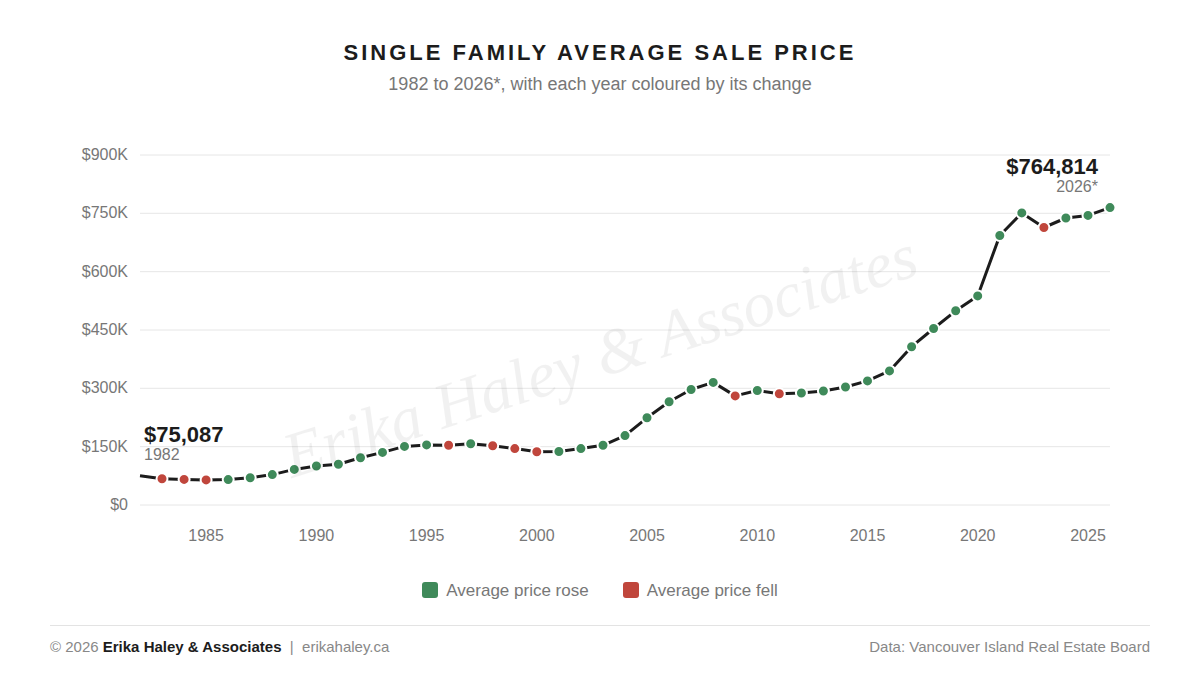
Each dot is a year: green when the average rose, red when it fell. The red dots are real, but they barely dent a line that climbs for four decades. Source: VIREB Graphstats.
Time in the Market Beats Timing the Market
Here is the number we find most reassuring. Pick any 10-year stretch in the single family numbers since 1982, and the average price ended higher than it started. That is all 35 of them, including stretches that began right before a dip. Even the weakest decade, 1993 to 2003, still finished 13.6% higher.
Condos ended higher in 16 of their 17 ten-year stretches. The one exception, 2006 to 2016, is a good reminder that patience matters: the condo average took about ten years to climb back past its 2008 high. Most people buy a home to live in for years, and that is exactly the timeline where the green adds up.
Leave the Timing to the Professionals
Waiting to buy at the exact bottom sounds smart, but it is very hard to do. A dip is only obvious in hindsight, and the rebound usually starts before the headlines catch up. After the 2023 dip, the single family average was back above its previous high within about three years. Buyers who wait for prices to fall further can end up paying more, or miss the home that was right for them.
Timing the market is a job for professionals who watch it every day, and even we would never promise anyone the bottom. For most families, the right time to buy is when the numbers work for you: steady income, a mortgage pre-approval, and a home that fits your life. From there, every mortgage payment builds equity in a home of your own.
Every Market Has an Upside
When prices are rising: Owners build equity, sellers have strong prices to work with, and buyers who got in earlier are rewarded for it. Right now the single family average is up 2.4% over the previous 12 months, a steady, healthy pace.
When prices dip: Buyers get more choice, more time to decide and more room to negotiate. Sellers who are also buying often come out even or ahead, because the next home costs less too. Today the average condo is still about 10% below its 2022 high, which is a real opportunity for first-time buyers and downsizers.
Up or down, a well-priced home in Campbell River keeps selling, and a well-prepared buyer keeps finding good homes.
Thinking About Your Next Move?
Whether this year's square turns out green or red, we can help you work out whether now is the right time for you. Curious what your home is worth today? Request a free home evaluation. Ready to start looking? Set up your automatic property search.
A note on the numbers: these are average sale prices and are not adjusted for inflation. In a smaller market like Campbell River, a handful of high-end sales can move the average in any single year, which is why the long-term trend matters more than any one square. For what your own home is worth, ask us for a personal market analysis. 2026 figures are the 12 months ending August 31, 2026.

Comments:
Post Your Comment: