
The quick read: Campbell River's average single family sale price reached $802,843 in September, up 14% from a year ago, and the 12-month rolling average hit a new high of $772,642. Sales slowed to their usual fall pace, but the bigger story is supply: new listings fell by nearly a third, and that is quietly tightening the market heading into a busy election month.
The Numbers
Single Family Detached
Average sale price: $802,843, up 14% from September 2025 (median $762,500)
12-month rolling average: $772,642, up 4.1% from a year ago and a new two-year high
Homes sold: 26, down from 33 last September
New listings: 40, down from 56
Active listings: 129, down from 151
Average days to sell: 68
Sellers received almost 98% of their asking price
Row / Townhouse
Average sale price: $524,529 (median $519,000) on 7 sales, versus 8 last September
Sellers received over 99% of asking, the strongest ratio of any property type
Average days to sell: 87
Condo Apartment
Average sale price: $473,250 (median $475,250) on just 4 sales, versus 9 last September
Over the past 12 months, condo values are up 1.9%
Average days to sell: 61, about the same as last year
Land
One lot sold in September, at $575,000
Active land listings: 60, up from 43 a year ago
Over the past 12 months: 17 land sales, versus 12 the year before
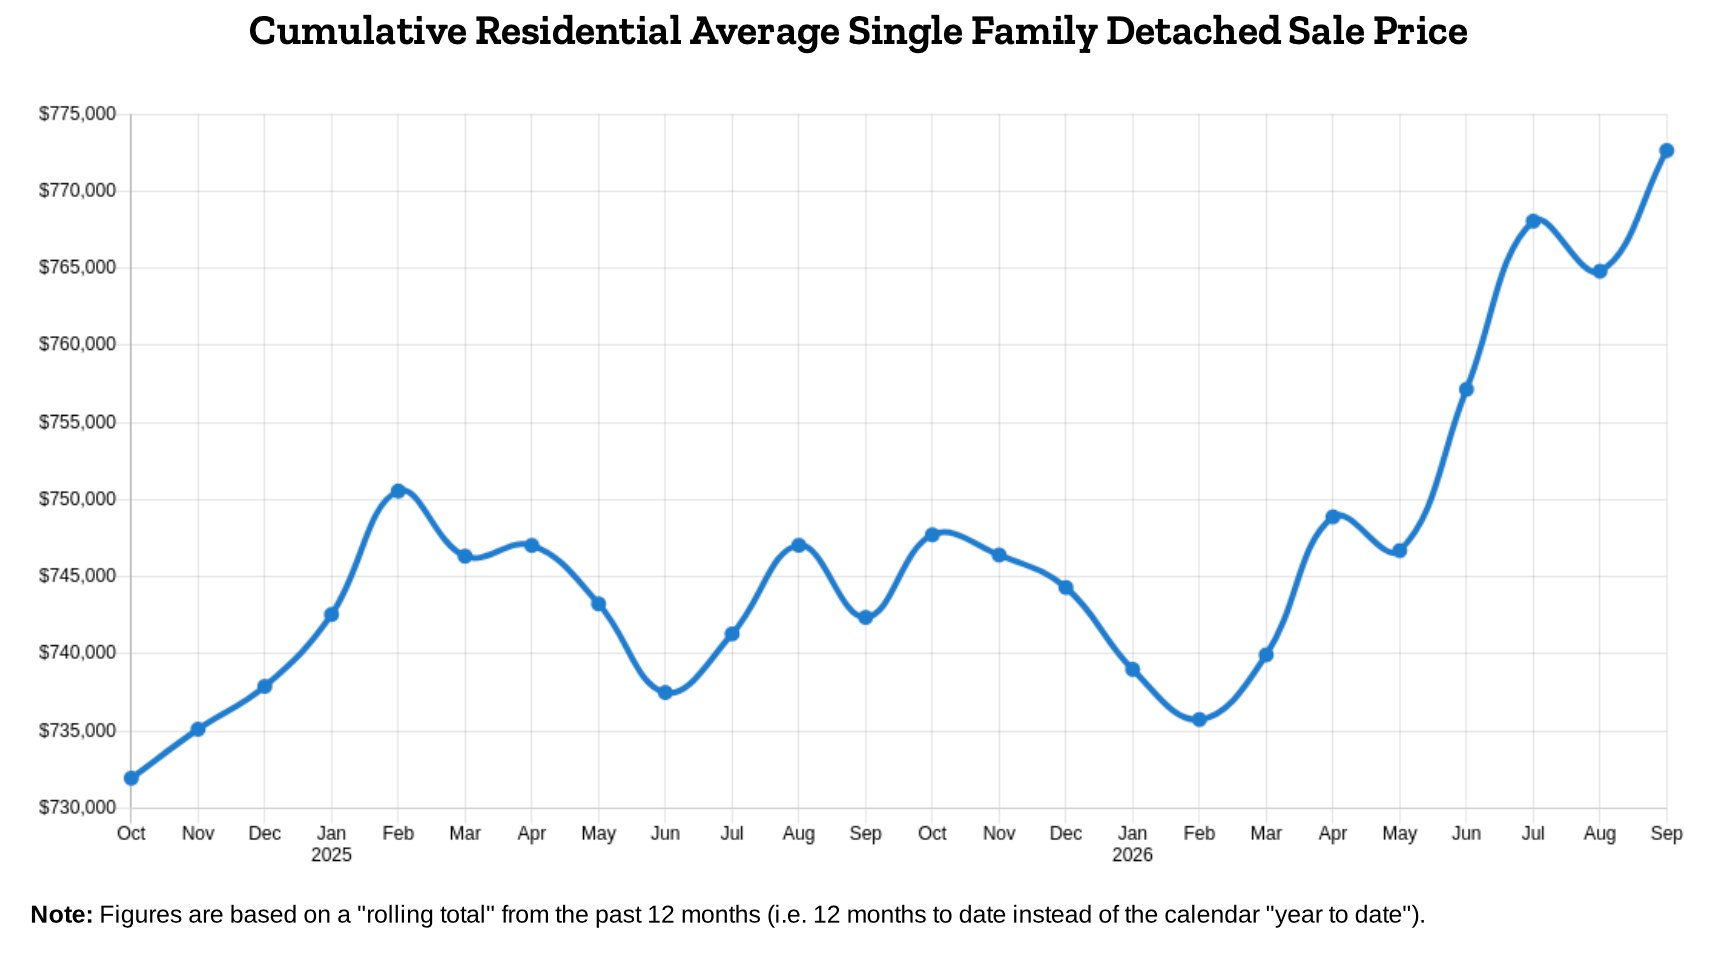
The 12-month rolling average climbed to about $772,600 in September, topping July's previous peak. Source: VIREB Graphstats.
What's Actually Happening
The headline price is eye-catching, but the number to watch is supply. Only 40 new single family listings came on in September, compared with 56 a year ago, and active inventory is down to 129 homes from 151. Fewer choices for buyers is what keeps prices firm, and it is why the 12-month average keeps climbing even as monthly sales settle into their usual fall rhythm.
A word of caution on that 14% jump. Campbell River is a small market, and with only 26 single family sales in September, a few higher-end homes can pull the monthly average up without a typical home changing in value at all. The MLS® Home Price Index, which tracks a typical "benchmark" home rather than the mix of what happened to sell, valued a benchmark single family home in Campbell River at about $686,800 in its most recent (July) release, up a steady one per cent from a year earlier. The 12-month average and the benchmark tell the same story: steady, gradual growth.
Townhouses were the quiet standout, with sellers getting over 99% of their asking price. Their 14% year-over-year dip in average price reflects an unusually high-priced group of sales last September rather than falling values. Condo and land figures are based on very few sales this month, so we would not read much into their monthly averages.
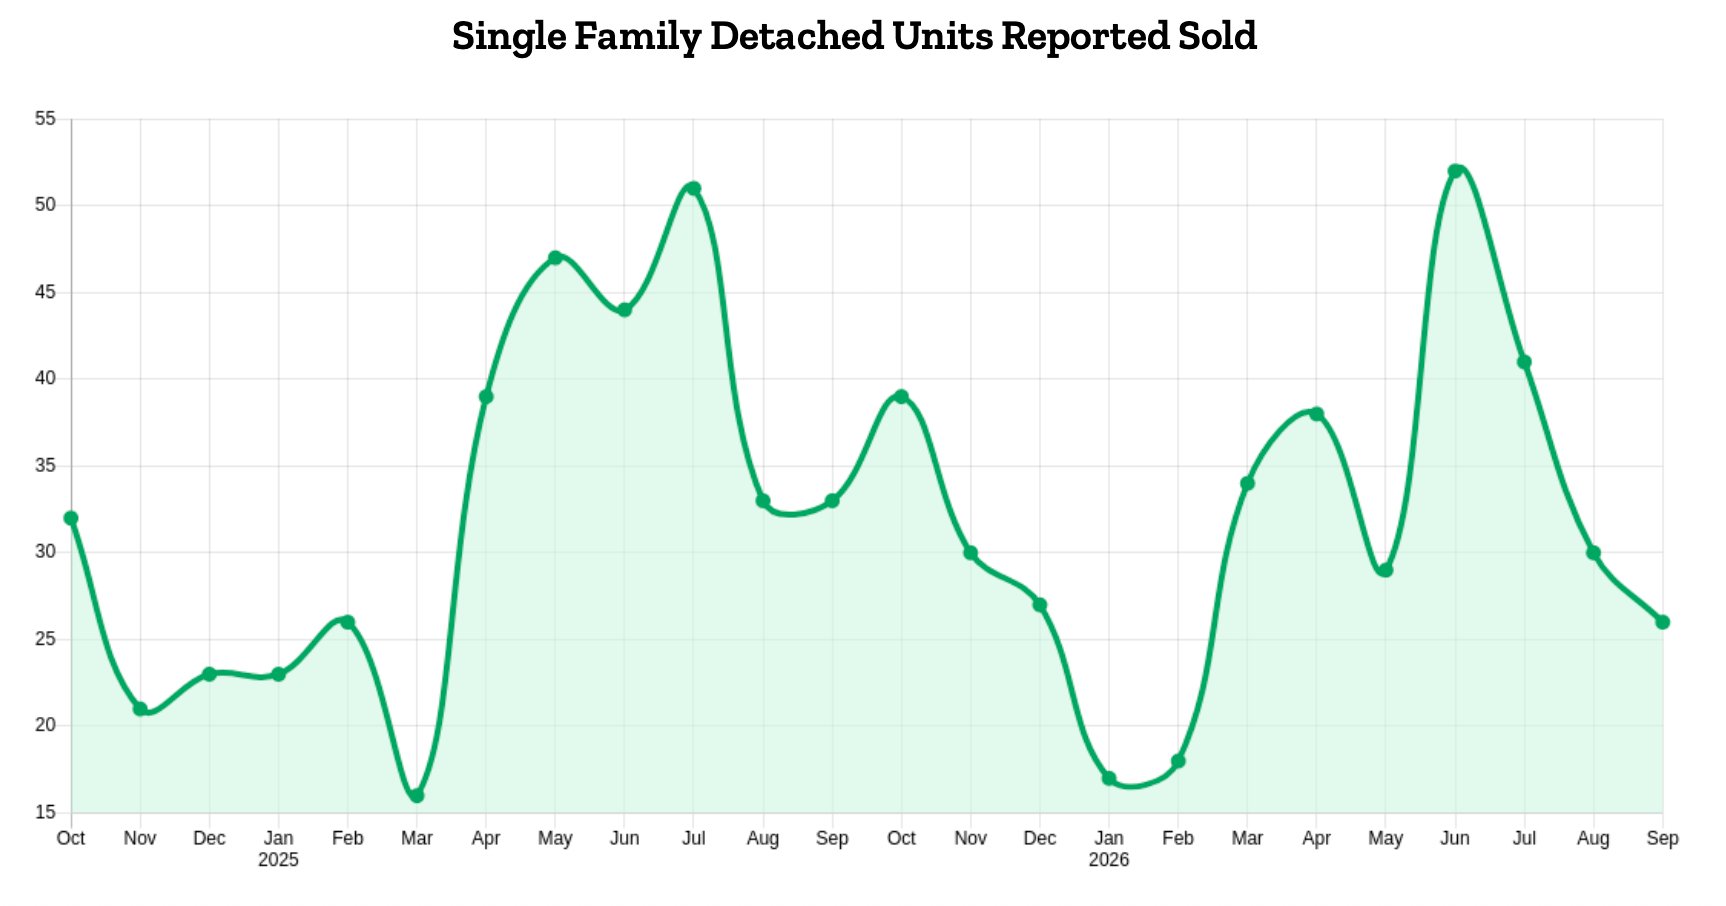
26 single family homes sold in September, down from a summer peak of 52 in June. Source: VIREB Graphstats.
October Is Unique: Two Elections
October is an unusual month in British Columbia: we are voting twice. Campbell River elects a new mayor and council on October 17, and a week later, on October 24, British Columbians vote in a snap provincial election.
Elections often make people wait. Some buyers and sellers would rather see who forms government, and what that means for housing policy, taxes and development, before making a big move. City council shapes the local picture: zoning, new housing approvals, infrastructure and property taxes. The province sets the broader rules, from housing supply targets to property transfer and speculation taxes.
Still, an election pause usually lasts only a few weeks, and the fundamentals that drive our market do not change on voting day: supply, affordability, interest rates and the steady pull of the Island lifestyle.
If You're Selling
With fewer new listings coming on, well-priced homes are facing less competition than they did a year ago. That said, homes are taking 68 days on average to sell, so pricing it right from day one still matters. Averages tell the big story, but the only way to know what your home is worth is a market analysis of your specific property. Request a free home evaluation.
If You're Buying
Inventory is tighter than last year, so good homes in popular areas will not sit long. At the same time, an election month can mean fewer active buyers and a little more room to negotiate. Land buyers have their best selection in years, with 60 lots and acreages on the market. Get new listings sent to you first.
The Bottom Line
Prices are holding firm and edging up, supply is tightening, and October's two elections may cause a short pause. For the long view, see our record of Campbell River home prices since 1982. Wondering what these numbers mean for your home or your next move? We are always happy to chat.
Erika 250-202-1058 | Jenna 778-348-3599 | erika@erikahaley.ca
Statistics courtesy of the Vancouver Island Real Estate Board, Zone 1 Campbell River, September 2026. Single family figures exclude acreage and waterfront properties. Benchmark price from the MLS® Home Price Index (VIREB stats package, July 2026 release). Election dates from Elections BC and the City of Campbell River. Erika Haley & Associates, REMAX Ocean Pacific. Not intended to solicit properties already listed for sale.

Comments:
Post Your Comment: