Campbell River Home Prices Since 1982
How have home prices changed in Campbell River? We keep a year-by-year record of the Campbell River market going back to 1982 for single family homes and 2000 for condos, using Vancouver Island Real Estate Board (VIREB) statistics. The short version: prices have dipped in some years, but over any ten-year stretch they have always ended higher.
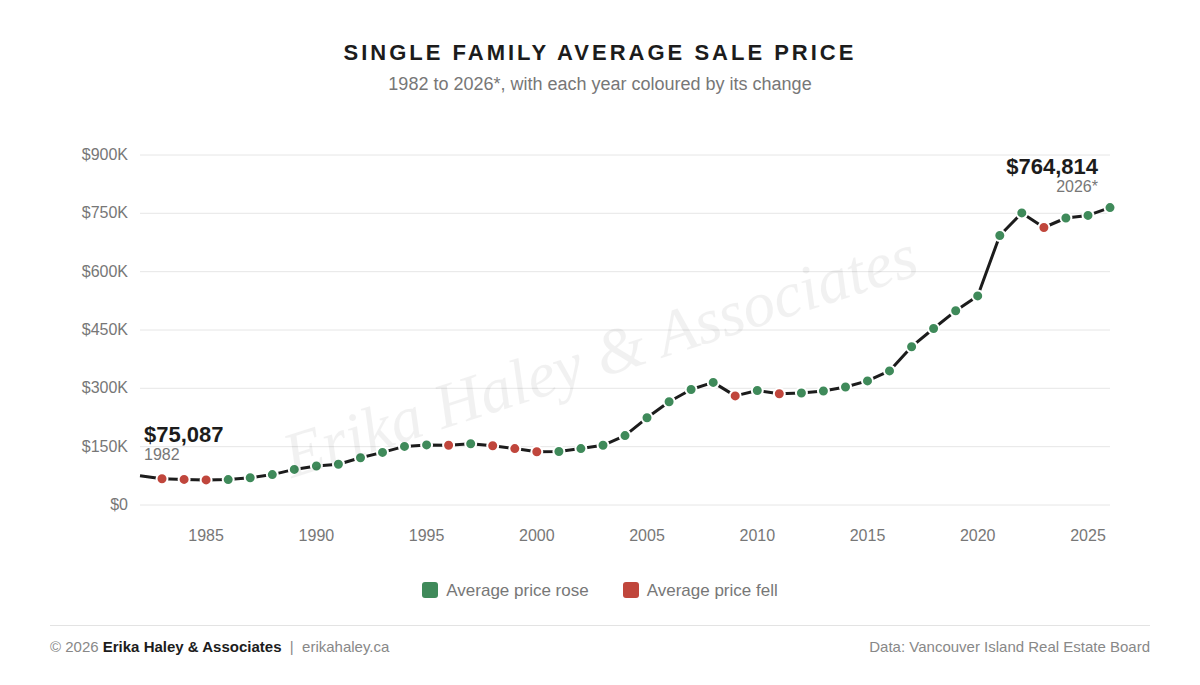
Each dot is a year: green when the average sale price rose, red when it fell. Source: VIREB Graphstats.
Campbell River Single Family Home Prices by Year
Average sale price of single family detached homes in Zone 1, Campbell River, newest first.
| Year | Avg Sale Price | Change | Homes Sold | Days to Sell |
|---|---|---|---|---|
| 2026 (12 months to Aug 31) | $764,814 | +2.7% | – | – |
| 2025 | $744,750 | +0.9% | 408 | 55 |
| 2024 | $737,898 | +3.4% | 333 | 51 |
| 2023 | $713,655 | −5.0% | 348 | 51 |
| 2022 | $751,219 | +8.4% | 393 | 35 |
| 2021 | $692,906 | +28.8% | 535 | 30 |
| 2020 | $537,768 | +7.7% | 519 | 51 |
| 2019 | $499,315 | +10.0% | 454 | 35 |
| 2018 | $453,935 | +11.5% | 487 | 35 |
| 2017 | $407,174 | +18.1% | 613 | 42 |
| 2016 | $344,795 | +8.1% | 653 | 55 |
| 2015 | $319,007 | +5.1% | 489 | 70 |
| 2014 | $303,453 | +3.6% | 512 | 76 |
| 2013 | $293,037 | +1.8% | 457 | 68 |
| 2012 | $287,922 | +0.6% | 411 | 82 |
| 2011 | $286,299 | −2.7% | 430 | 86 |
| 2010 | $294,372 | +4.9% | 386 | 71 |
| 2009 | $280,561 | −11.0% | 479 | 92 |
| 2008 | $315,252 | +6.1% | 437 | 65 |
| 2007 | $297,046 | +11.8% | 651 | 61 |
| 2006 | $265,602 | +18.5% | 611 | 57 |
| 2005 | $224,131 | +25.5% | 559 | 42 |
| 2004 | $178,571 | +16.3% | 542 | 46 |
| 2003 | $153,588 | +5.8% | 415 | 65 |
| 2002 | $145,119 | +5.5% | 393 | 75 |
| 2001 | $137,584 | +0.6% | 329 | 96 |
| 2000 | $136,784 | −5.7% | 290 | 110 |
| 1999 | $145,034 | −4.9% | 346 | 110 |
| 1998 | $152,494 | −3.2% | 310 | 97 |
| 1997 | $157,544 | +2.5% | 356 | 78 |
| 1996 | $153,724 | −0.5% | 480 | 81 |
| 1995 | $154,538 | +2.6% | 395 | 79 |
| 1994 | $150,578 | +11.4% | 462 | 53 |
| 1993 | $135,216 | +11.5% | 440 | 55 |
| 1992 | $121,267 | +15.6% | 518 | 53 |
| 1991 | $104,936 | +4.5% | 494 | 66 |
| 1990 | $100,392 | +9.7% | 353 | 63 |
| 1989 | $91,487 | +17.0% | 461 | 58 |
| 1988 | $78,179 | +11.4% | 418 | 58 |
| 1987 | $70,186 | +7.3% | 336 | 74 |
| 1986 | $65,382 | +1.2% | 264 | 79 |
| 1985 | $64,633 | −1.9% | 295 | 79 |
| 1984 | $65,886 | −2.3% | 215 | 94 |
| 1983 | $67,462 | −10.2% | 217 | 100 |
| 1982 | $75,087 | – | 147 | 106 |
© 2026 Erika Haley & Associates. Compiled from VIREB Graphstats. Please do not reproduce without permission.
Campbell River Condo Prices by Year
Average sale price of condo apartments in Zone 1, Campbell River, newest first.
| Year | Avg Sale Price | Change | Units Sold | Days to Sell |
|---|---|---|---|---|
| 2026 (12 months to Aug 31) | $431,488 | +5.8% | – | – |
| 2025 | $407,931 | −8.3% | – | 69 |
| 2024 | $444,680 | +5.5% | 84 | 61 |
| 2023 | $421,392 | −11.8% | 96 | 57 |
| 2022 | $477,876 | +31.7% | 89 | 33 |
| 2021 | $362,949 | +25.1% | 126 | 40 |
| 2020 | $290,190 | +8.8% | 96 | 56 |
| 2019 | $266,705 | +6.6% | 102 | 54 |
| 2018 | $250,131 | +13.9% | 110 | 33 |
| 2017 | $219,527 | +28.6% | 126 | 44 |
| 2016 | $170,672 | +5.9% | 117 | 91 |
| 2015 | $161,239 | −17.6% | 82 | 132 |
| 2014 | $195,686 | +9.5% | 47 | 124 |
| 2013 | $178,727 | −1.5% | 57 | 119 |
| 2012 | $181,453 | +21.2% | 48 | 124 |
| 2011 | $149,767 | −15.8% | 48 | 114 |
| 2010 | $177,773 | −6.7% | 47 | 153 |
| 2009 | $190,441 | −17.2% | 38 | 140 |
| 2008 | $230,064 | +20.0% | 90 | 63 |
| 2007 | $191,746 | +5.3% | 111 | 94 |
| 2006 | $182,040 | +28.5% | 143 | 93 |
| 2005 | $141,688 | +11.2% | 168 | 81 |
| 2004 | $127,446 | +19.6% | 111 | 111 |
| 2003 | $106,516 | +9.4% | 73 | 261 |
| 2002 | $97,394 | −2.5% | 54 | 248 |
| 2001 | $99,890 | −4.6% | 60 | 271 |
| 2000 | $104,652 | – | 42 | 310 |
© 2026 Erika Haley & Associates. Compiled from VIREB Graphstats. Please do not reproduce without permission.
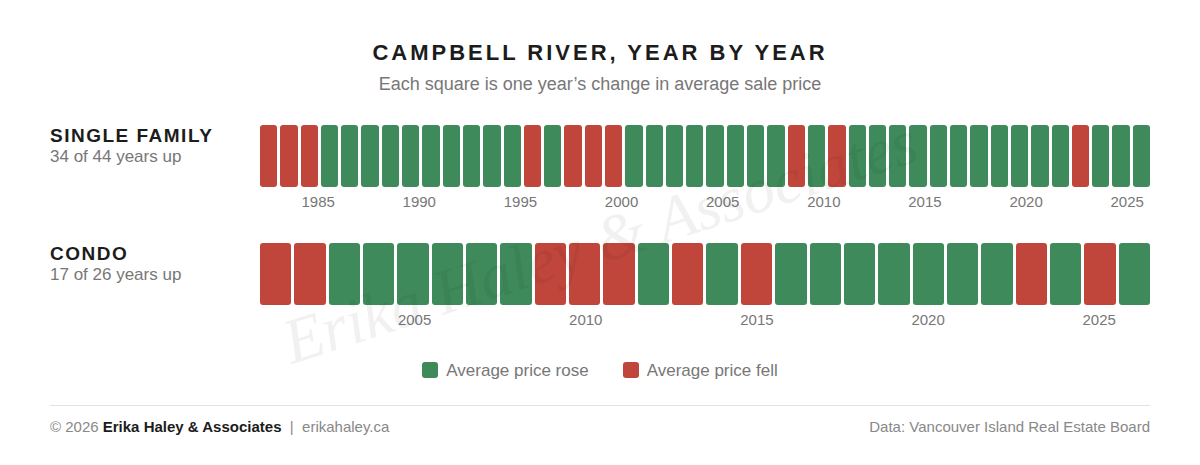
Single family homes rose in 34 of 44 years; condos rose in 17 of 26. Source: VIREB Graphstats.
What 44 Years of Prices Tell Us
Red happens, green wins. The down years came in short clusters: the early 1980s, the late 1990s, 2009 and 2011, and 2023. The biggest single-year drop was 11% in 2009, and every dip was followed by a return to growth.
Time in the market beats timing the market. Pick any ten-year stretch since 1982 and the average single family price ended higher than it started, even the weakest decade, 1993 to 2003. Most people buy a home to live in for years, and that is exactly the timeline where the growth adds up.
Condos swing more. Condo prices rose about four times since 2000, but the ride has been bumpier, and the condo average took roughly ten years to climb back past its 2008 high.
For the full story, read our article Why Green Wins: The Long View on Campbell River Real Estate, or see the latest numbers in our Campbell River market report, updated every month.
What 21 Years of Experience Means
Campbell River has been through booms, corrections and recoveries, and the long view rewards people who understand the cycle. A chart shows what happened. Experience tells you what it means for your home, your timing and your price. Our team has helped Campbell River families buy and sell through every kind of market since 2004, with more than 750 completed transactions.
Meet the team behind the numbers →
What is your home worth today? Averages tell the big story, but every home is different. Request a free home evaluation and we will prepare a market analysis for your property. Thinking about buying? Start with our Campbell River neighbourhood guides.
A note on the numbers: these are average sale prices from VIREB Graphstats for Zone 1, Campbell River, and are not adjusted for inflation. In a smaller market a handful of high-end sales can move the average in any single year, so the long-term trend matters more than any one year. Single family figures exclude acreage and waterfront. 2026 figures are the 12 months ending August 31, 2026. Updated each January.