Campbell River Real Estate Market Report
Updated October 2026 · VIREB Zone 1, Campbell River · Updated every month
The quick read: Campbell River's average single family sale price was $802,843 in September, up 14% from a year ago, and the 12-month rolling average reached a new high of $772,642. New listings fell by nearly a third, which is quietly tightening the market heading into a busy election month.
September Sales at a Glance: Single Family Homes
Single family figures exclude acreage and waterfront properties.
Campbell River Market by Property Type
| September 2026 sales | Avg Sale Price | vs. Last Year | Sold | Days to Sell |
|---|---|---|---|---|
| Single family | $802,843 | +14% | 26 | 68 |
| Condo apartment | $473,250 | +7% | 4 | 61 |
| Row / townhouse | $524,529 | −14% | 7 | 87 |
| Land | $575,000 | – | 1 | – |
© 2026 Erika Haley & Associates. Compiled from VIREB Graphstats. Please do not reproduce without permission.
Figures are September 2026 sales. Condo and land numbers are based on very few sales (4 condos and 1 lot), so their averages can swing widely from month to month. The townhouse dip reflects an unusually high-priced group of sales last September rather than falling values.
Average Sale Price: 12-Month Rolling
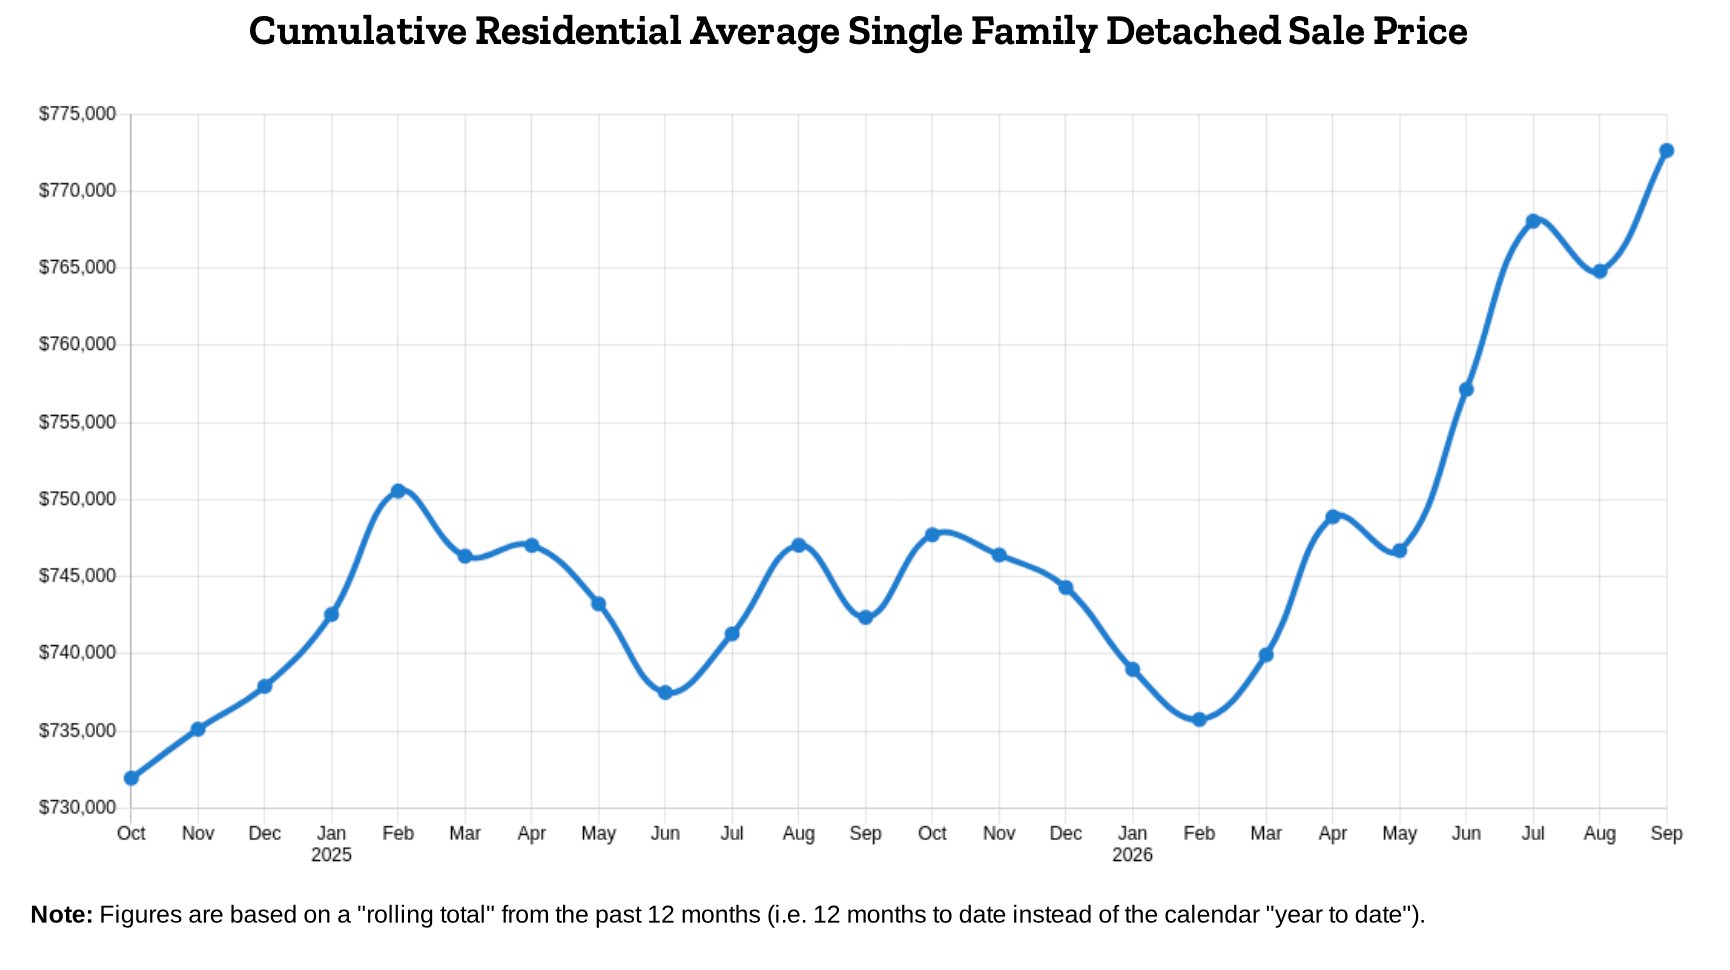
The 12-month rolling average climbed to about $772,600, a new two-year high, topping July's previous peak. Source: VIREB Graphstats.
Single Family Homes Sold by Month
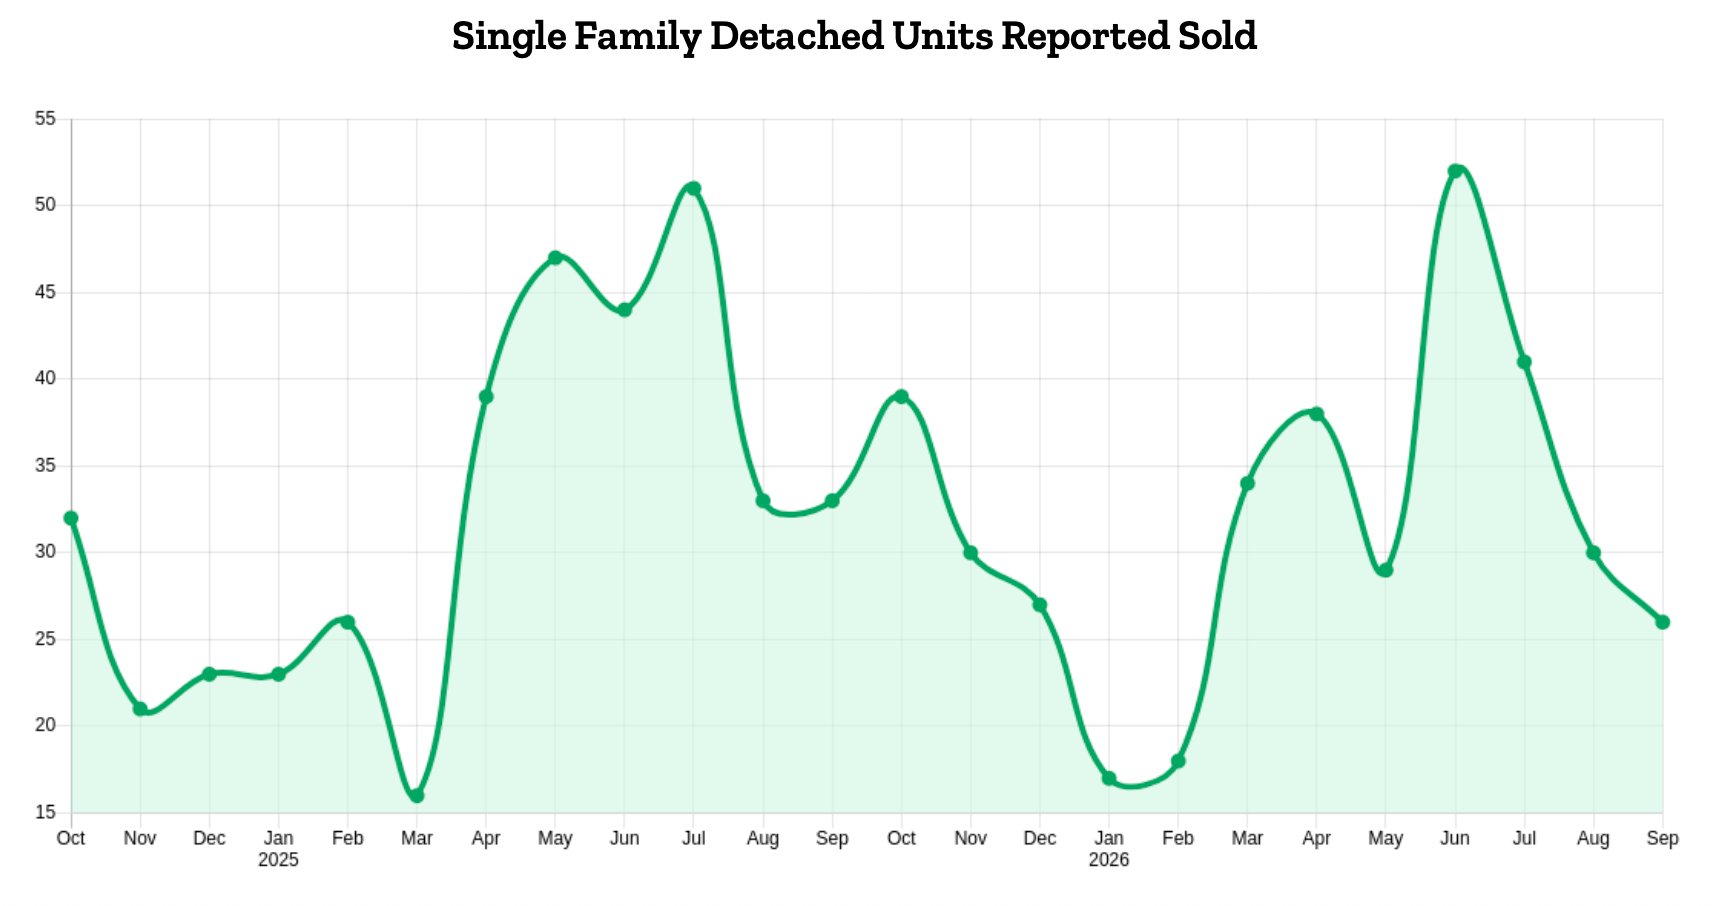
26 single family homes sold in September, down from a summer peak of 52 in June and 33 last September. Source: VIREB Graphstats.
What It Means Right Now
If you're selling: With 40 new single family listings in September versus 56 a year ago, well-priced homes face less competition. Homes are still averaging 68 days to sell, so pricing it right from day one matters. Find out what your home is worth today.
If you're buying: Inventory is down to 129 single family homes from 151 a year ago, so good homes in popular areas will not sit long. Land buyers have their best selection in years, with 60 lots and acreages for sale. Get new listings sent to you first.
October: Two Elections
Campbell River elects a new mayor and council on October 17, and British Columbians vote in a provincial election on October 24. Some buyers and sellers may wait to see what the results mean for housing policy and taxes, but election pauses usually last only a few weeks, and fewer active buyers can mean more room to negotiate. Read more in our October market update.
The Long View
One month is a snapshot. For the bigger picture, see Campbell River home prices since 1982, our year-by-year record of average prices, sales and days to sell going back more than 40 years.
Monthly Market Updates
Each month we also publish a short market update on our blog. Recent updates:
Want numbers for your street, not just the city? Averages tell the big story, but every home is different. Request a free home evaluation, or call Erika at 250-202-1058 or Jenna at 778-348-3599.
About these numbers: average sale prices, sales and days to sell are from the Vancouver Island Real Estate Board (VIREB) Graphstats report for Zone 1, Campbell River, covering September 2026 sales. Single family figures exclude acreage and waterfront. Averages can move sharply in a month with few sales, so the trend over several months matters more than any one month. Statistics © 2026 Vancouver Island Real Estate Board. Erika Haley & Associates, REMAX Ocean Pacific. Not intended to solicit properties already listed for sale.